Cartesolaire.brussels - Zonnekaart.brussels
The Brussels-Capital Region's solar cadastre makes it possible to
assess the solar energy potential of the roofs of buildings in the
Region. The application was developed in response to a specific
request from the Brussels Environment energy department, and the
data schema is therefore specific to BE
![]() . The application supplied is a dedicated extension to the platform
cartostation
, deployed under the name Geodata within the Brussels Environment
department. It is an application aimed at the general public, to
provide synthetic and scientifically valid information.
. The application supplied is a dedicated extension to the platform
cartostation
, deployed under the name Geodata within the Brussels Environment
department. It is an application aimed at the general public, to
provide synthetic and scientifically valid information.
The cartographic consultation interface is combined with a yield
calculator that displays the solar energy potential per building at
a specific address.
 The solar potential register data is generated
 on the basis of 3D data for the region (UrbIS-3D), weather data
(TMY), and a statistical analysis of obstacles to the installation
of panels by building type.
on the basis of 3D data for the region (UrbIS-3D), weather data
(TMY), and a statistical analysis of obstacles to the installation
of panels by building type.
 The shading of surrounding buildings is also taken into account in
the calculation for each of the region's one million roof areas.
The shading of surrounding buildings is also taken into account in
the calculation for each of the region's one million roof areas.
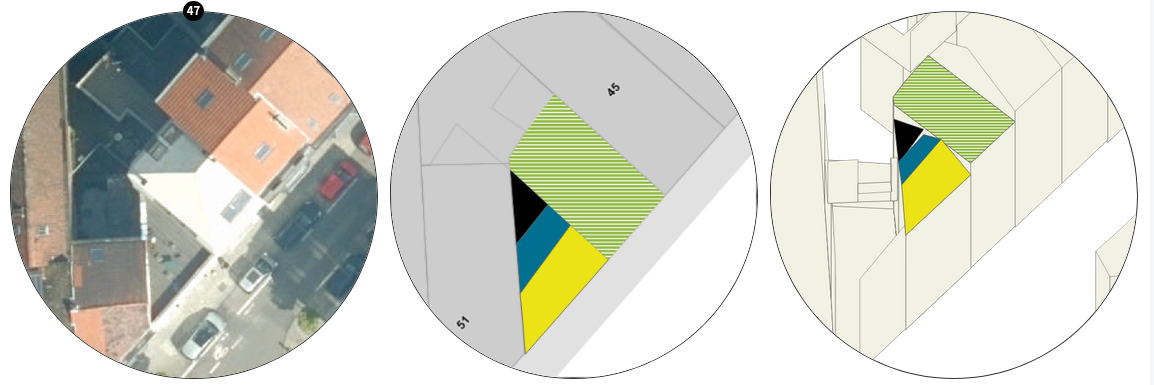
The remote sensing tool enables pre-categorised objects to be encoded on the basis of an orthophoto and a chosen reference frame (e.g. the land register). It was developed as part of the Brussels-Capital Region's solar cadastre.
An ergonomic cartographic interface enables multiple operators to quickly encode elements, while a summary page provides an overview of the progress of the data collection work in the chosen reference frame.
As part of the Solar Cadastre project, this tool was used to carry out a statistical study of roof obstacles to the installation of solar panels, by building type.
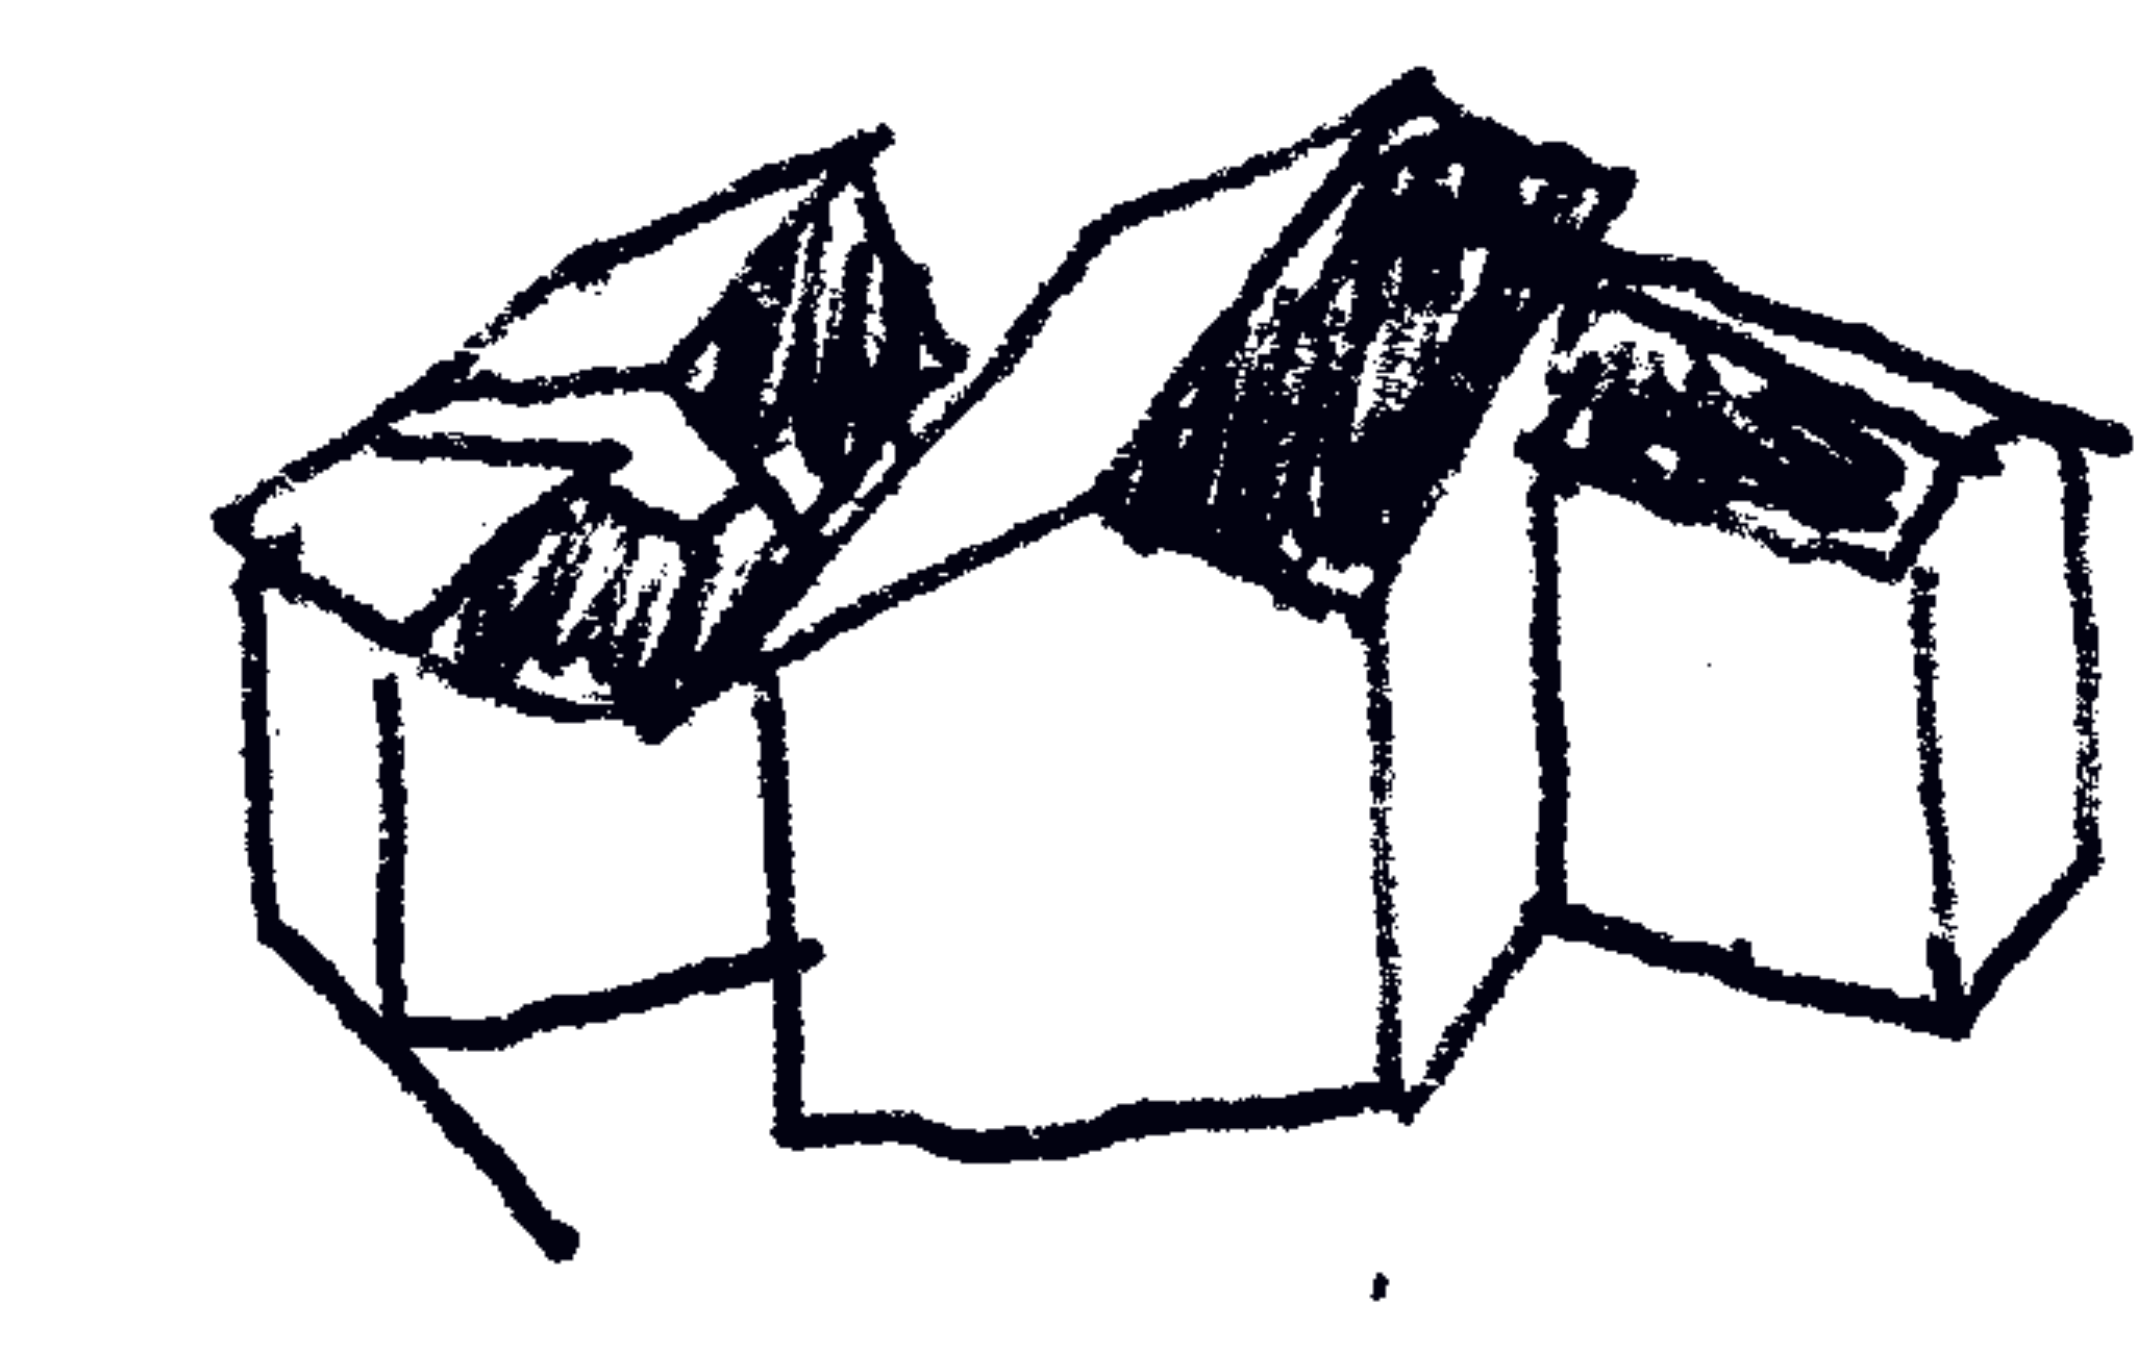
Development of a tool for drawing three-dimensional geographical data while remaining close to the visual codes of cartography. In particular, this tool makes it possible to :
- draw multiple viewpoints of the same area
- preserve the legend of a plan view
- generate animations
- take into account multiple 3D layers